
Introduction
Context
This project was built in the context of the data analytics program at Career Foundry with the purpose of demonstrating my mastery in data preparation, data analysis, visualization, and storytelling.
Project Overview
The United States has an influenza season where more people than usual suffer from the flu. Some people, particularly those in vulnerable populations, develop serious complications and end up in the hospital. Hospitals and clinics need additional staff to adequately treat these extra patients.
Objective
To help a medical staffing agency to plan for the influenza season, a time when additional staff are in high demand. My job was to examine trends in influenza and understand how they can be used to determine when to send staff, and how many, to each state.
Software used
Excel and Tableau
Data sources:
- Population data by geography (US Census Bureau)
- Influenza deaths by geography, time, age, and gender (source: CDC)
- Counts of influenza laboratory test results by state (CDC)
- Survey of flu shot rates in children (CDC)
Tasks performed
I started by defining the research questions and hypothesis.
- Clarifying questions: Which states are most affected by influenza? When is flu season? Which states have the most residents in vulnerable populations?
- Funnelling questions: Is flu season the same in every state? Is flu season the same length every year? Is flu season only once a year?
- Defining hypothesis: If a state has a larger proportion of vulnerable population, then more deaths from flu will occur.
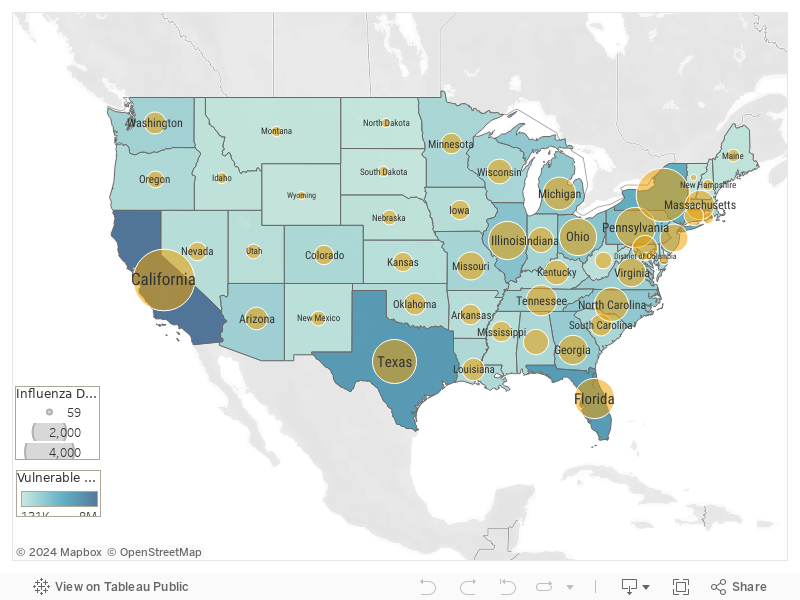
After having checked and solved data integrity issues in the data sets, I continued by creating a map showing the distribution of population in the U.S.A, using State as the spatial boundary.
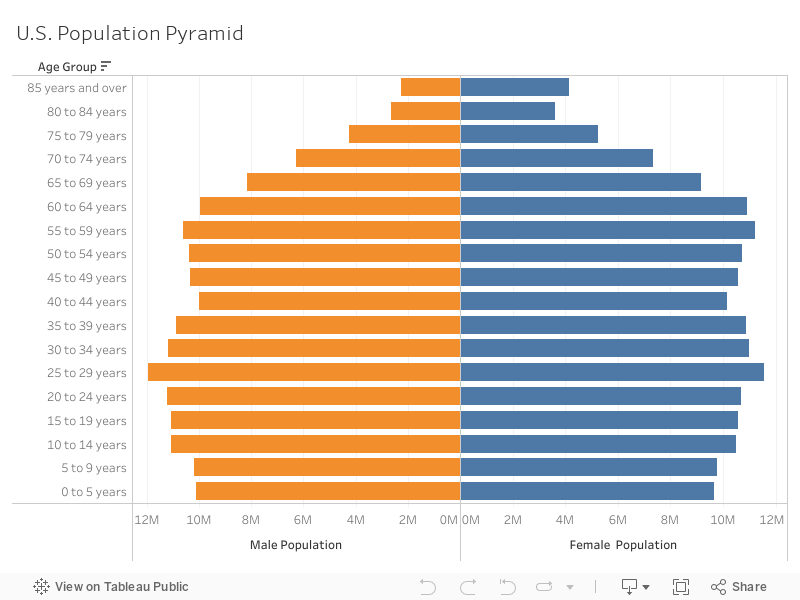
I followed by exploring patterns in the distribution of the U.S. population in terms of age and sex.
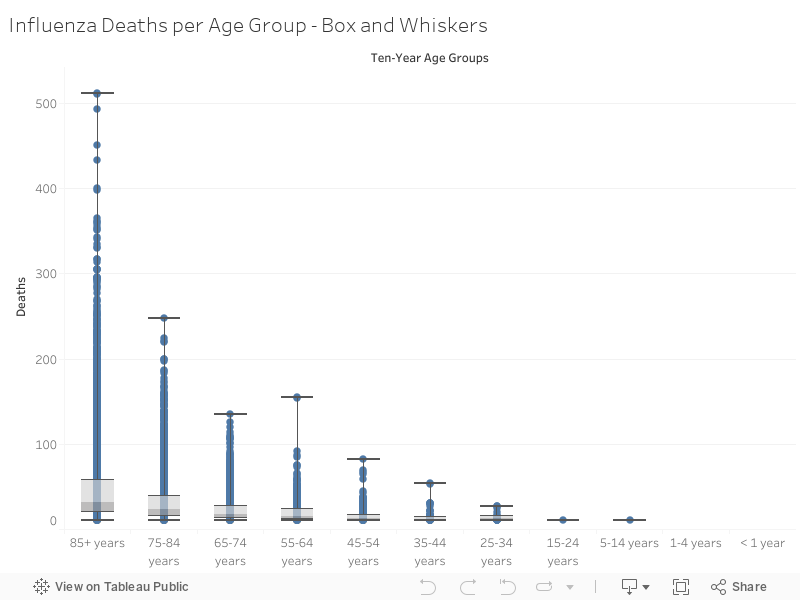
The next visualization show confirms the pre-existing idea that older people are more likely to die from the flu.
The next step was to test the hypothesis. After sourcing the necessary variables, I conducted descriptive analysis:
| Proportion of vulnerable population per State | Average flu deaths per State | |
| Original dataset | Population data by geography (US Census Bureau) | Influenza deaths by geography, time, age, and gender (source: CDC) |
| Sample or population | Population | Population |
| Normal distribution | Yes | Yes |
| Mean | 22% | 1056 |
| Variance | 0.0002 | 1319646.94 |
| Standard deviation | 0.0154 | 1148.76 |
| Outlier percentage | 7.8% | 3.9% |
I proceeded by calculating the strength of the correlation between the variables. The following table and graph present a summary of the results:
| Variables | “Total vulnerable population” and “average flu deaths per year” |
| Proposed relationship | If a state has a larger proportion of vulnerable population, then more deaths from flu will occur. |
| Correlation coefficient | 0.95 |
| Strenght of the correlation | Strong |
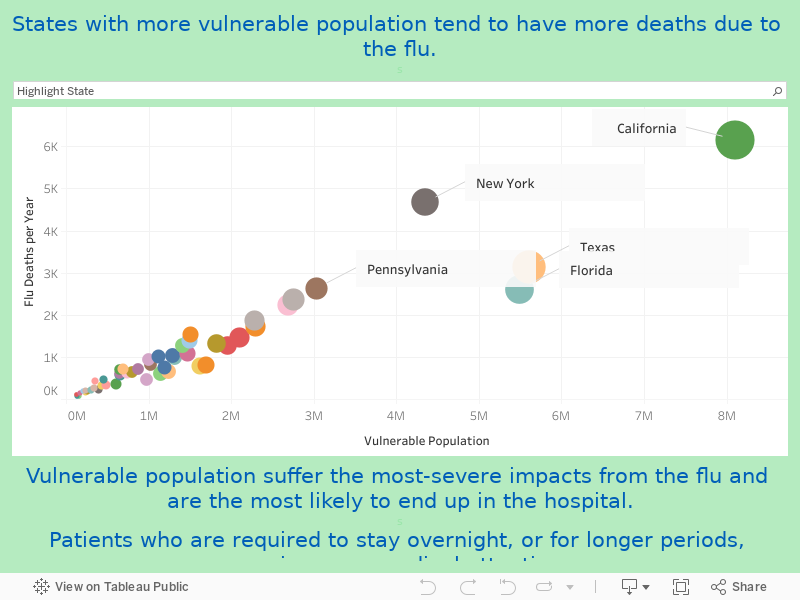
Based on these results, I was able to conclude that if a State has a more vulnerable population it will have more deaths due to influenza (flu).
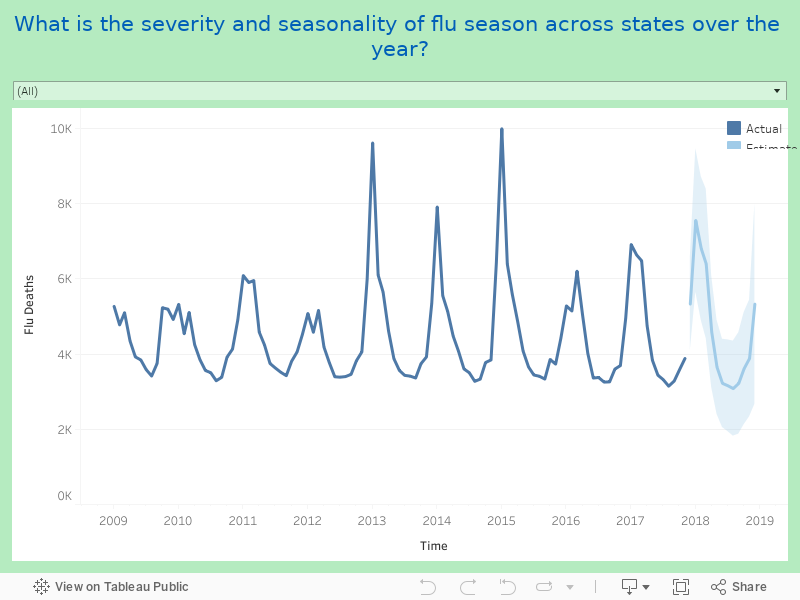
I continued addressing the research questions, this time working with time-series data regarding the number of deaths caused by the flu.
In this visualization, it is possible to observe the seasonality of the flu season for each State. I also included a forecast of the number of deaths caused by the flu using Linear extrapolation.
Conclusion
Finally, I created a storyboard to share the results of the project, the visualization I created, as well as the conclusions and recommendations.